
Enable the Visual Xccelerator Engine
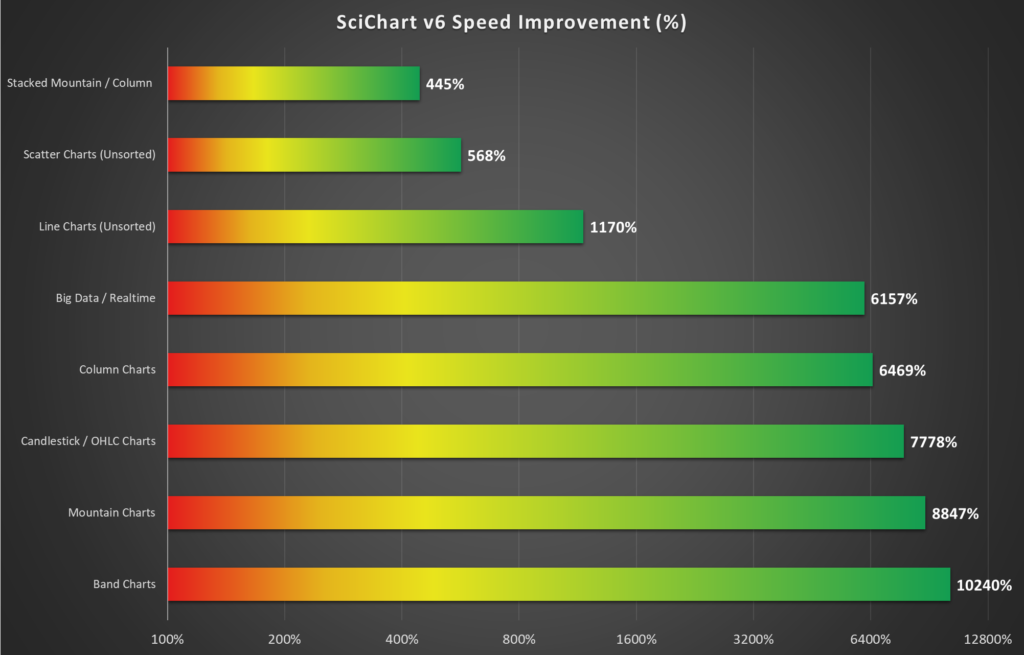
The VisualXcceleratorEngine which is new to SciChart WPF v6 pushes the boundaries of performance even further for our already high performance WPF Charts.
Enable this engine to turn on DirectX rendering and a whole host of optimisations for incredible performance improvements over SciChart WPF v5's DirectX engine.
To enable the VisualXccelerator engine, use the following code. This is enabled per SciChartSurface.
Ensure ResamplingModes are used
By default, SciChart uses resampling (culling) of data to ensure the minimum viable dataset is displayed on the screen. Resampling is intended to be lossless, and automatic.
If you disable resampling (setting BaseRenderableSeries.ResamplingMode = None) you will experience a degredation in performance. This is more pronounced in the software (non DirectX) renderers.
Setting RenderPriority
By default, SciChart throttles rendering so it only draws when necessary, as opposed to every property or data change. The default throttling results in approximately 60FPS (Frames per second).
The SciChartSurface.RenderPriority property may be used to lower the priority of rendering to below that of Mouse and Input in WPF. This is an extremely useful property if you are experiencing a hanging UI or stutter in the user interface, because when this happens it means the WPF Message Loop (UI Thread) is starved and is unable to process events.
To change the render priority, please use the following code. In extremely high CPU scenarios, or when running SciChart on a notebook or computer with slow CPU then this property can have the biggest change to responsiveness of the chart.
| Setting RenderPriority |
Copy Code |
|---|---|
var sciChartSurface = new SciChartSurface(); sciChartSurface.RenderPriority = RenderPriority.Low; | |
Or,
| Setting RenderPriority |
Copy Code |
|---|---|
<SciChartSurface RenderPriority="Low"/> | |
Note that setting RenderPriority to Immediate is not recommended, except for some edge cases like printing or exporting images. For realtime charts, set RenderPriority to Normal, or Low.
Limiting Framerate
An alternative to SciChartSurface.RenderPriority is to set SciChartSurface.MaxFrameRate. Lower framerates will reduce the number of times SciChart attempts to draw per second.
| Limiting Framerate |
Copy Code |
|---|---|
var sciChartSurface = new SciChartSurface(); sciChartSurface.MaxFrameRate = 24; | |
Or,
| Limiting Framerate |
Copy Code |
|---|---|
<SciChartSurface MaxFrameRate="24" | |
NOTE: To reset MaxFrameRate, set it to null.
StrokeThickness = 1 is Faster
NOTE: This hint only affects the software renderers.
Drawing more pixels = using more CPU. Setting StrokeThickness to 1 can result in higher performance by lowering stress on the the software renderers.
Switch Off AntiAliasing
NOTE: This hint only affects the software renderers.
Drawing alpha blended anti-aliased lines = using more CPU. Setting AntiAlias = false can result in higher performance by lowering stress on the the software renderers.
Use SolidColorBrush not LinearGradientBrush
NOTE: This hint only affects the software renderers
The FastMountainRenderableSeries, FastColumnRenderableSeries, FastCandlestickRenderableSeries types all support LinearGradientBrush fills as well as SolidColorBrush. Internally, these are implemented using a fast-caching texture engine, however, solid colors are a lot faster than gradient fills. Where possible, if performance is absolutely necessary, use solid colors for fills instead of gradient brushes.
PointMarkers and Scatter Series are Slower than Line Series
NOTE: This hint only affects the software renderers
For Scatter series and Line Series with PointMarkers, note the total point count will be lower than just for lines. This is because point-marker points require additional CPU to render. To minimise this effect, there are two things you could do:
- Make the PointMarker smaller! A 7-pixel diameter point-marker has 97% more area (and therefore more pixels to fill) than a 5-pixel diameter point-marker.
- Use the VisualXcceleratorEngine which is 50x faster at rendering Scatter Points than the software renderers and 5x faster than the old DirectX engine in SciChart WPF v5.
- Dynamically show/hide point-markers, or change marker size, as you zoom out, for example:
| PointMarkers and Scatter Series are Slower than Line Series |
Copy Code |
|---|---|
// Dynamically showing or hiding PointMarkers based on zoom level var xAxis = sciChartSurface.XAxis; xAxis.VisibleRangeChanged += (s,e) => { double xRangeDifference = xAxis.VisibleRangeChanged.AsDoubleRange().Diff; if (xRangeDifference > 100) // or arbitrary threshold value { sciChartSurface.RenderableSeries[0].PointMarker = null; } else { sciChartSurface.RenderableSeries[0].PointMarker = new EllipsePointMarker() { Width = 5, Height = 5, Fill = Colors.Blue }; } } | |
Dynamically Toggle Annotations if UIElement Annotations are slow
SciChart uses a Raster-based (Bitmap/Texture) rendering for all line series, however annotations are provided by WPF UIElements. UIElements (and sadly WPF) are not capable of high performance when thousands of elements are drawn, hence restricting the count of annotations is imperative to keeping performance up.
When drawing annotations, if possible, restrict the number of annotations on the chart at any one time to a few thousand. Again you can use a similar Level of Detail technique as that suggested above - when zooming out (handle XAxis.VisibleRangeChanged), you may hide the annotations (by swapping the entire SciChartSurface.Annotations collection with another AnnotationCollection).
| Dynamically Toggle Annotations if UIElement Annotations are slow |
Copy Code |
|---|---|
// Dynamically showing or hiding annotations based on zoom level var xAxis = sciChartSurface.XAxis; xAxis.VisibleRangeChanged += (s,e) => { double xRangeDifference = xAxis.VisibleRange.AsDoubleRange().Diff; if (xRangeDifference > 100) // or arbitrary threshold value { // Store and turn off all annotations this.savedAnnotations = sciChartSurface.Annotations; sciChartSurface.Annotations = new AnnotationCollection(); } else { // Restore annotations sciChartSurface.Annotations = this.savedAnnotations; } }; | |
Replace Annotations with Custom Drawing
Annotations provide a rich, useful API for overlaying markers onto the chart. If you require tens or hundreds of thousands of visual markers, annotations performance will be a hindrance. In this case, we often recommend using a scatter chart with a custom point marker. You can find info about our PointMarkers API in PointMarker API – BaseRenderableSeries.Pointmarker